Documentation IndexFetch the complete documentation index at: /docs/llms.txtUse this file to discover all available pages before exploring further.
Fetch the complete documentation index at: /docs/llms.txt
Use this file to discover all available pages before exploring further.
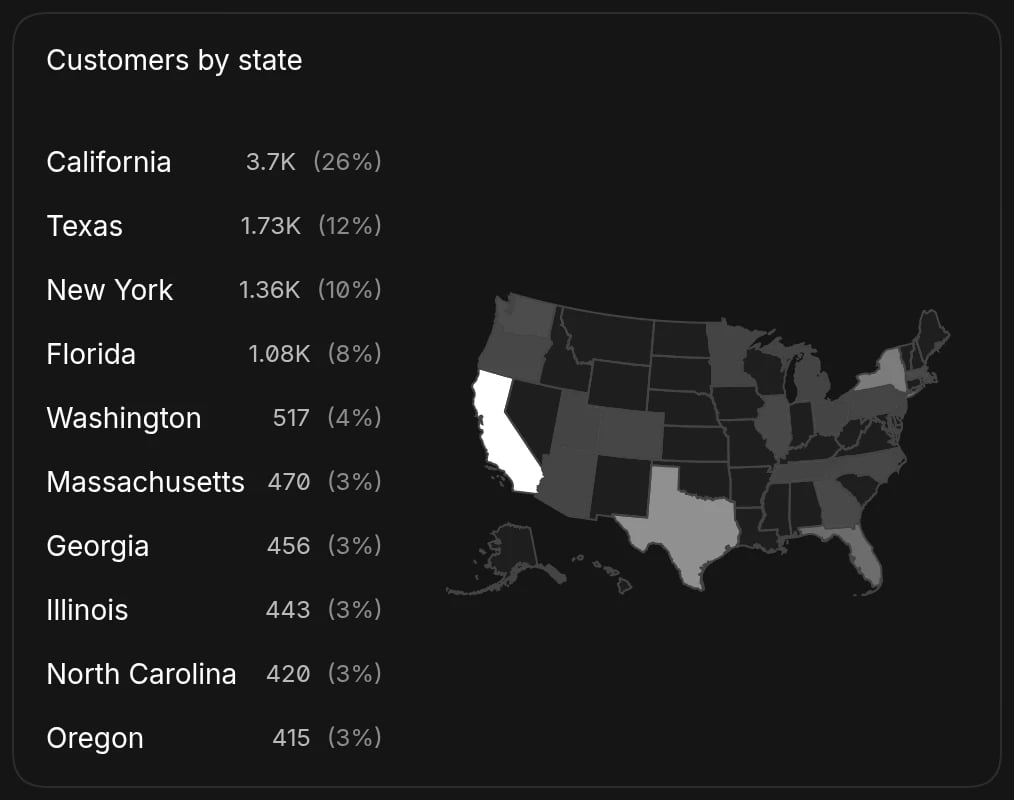
Geographic data display
Show website visitors by country as a map